ændrew.com v8
Waiting for TfL: bus punctuality on Transport for London's network
May 25, 2012
Londoners collectively spent an estimated 36 million hours waiting for late buses in 2011, data revealed through FOI has shown. That means every man, woman and child in London spent over four and a half hours waiting for late buses last year alone.
According to Transport for London’s quality of service indicators, excess waiting time (EWT) on TfL’s high frequency routes averaged 57 seconds per passenger journey between January 2011 and 2012. On a whole, roughly one minute per bus might not seem very much — however, it really adds up when multiplied over the 2.3 billion bus journeys made per year alone.1
“Transport for London operates a fleet of 8,500 buses over 700 routes 364 days of the year,” said a spokesperson for TfL. “It is one of the biggest operations in the UK and Europe. TfL monitors the performance of all bus companies contracted to provide services in London. Contracts are rigorously managed and financial penalties are levied if a bus company is not meeting targets for reasons within their control. London’s buses generally perform very well. Where issues are identified however, they are quickly rectified.”
TfL measures bus performance two different ways. On high frequency routes, which run five or more buses per hour, users are less likely to use a timetable and thus EWT is used to measure how long they’ve had to spend waiting because of irregular or non-running buses. Meanwhile, users on low frequency routes are more likely to use a timetable and thus the percentage chance that a bus is running on time is more important.
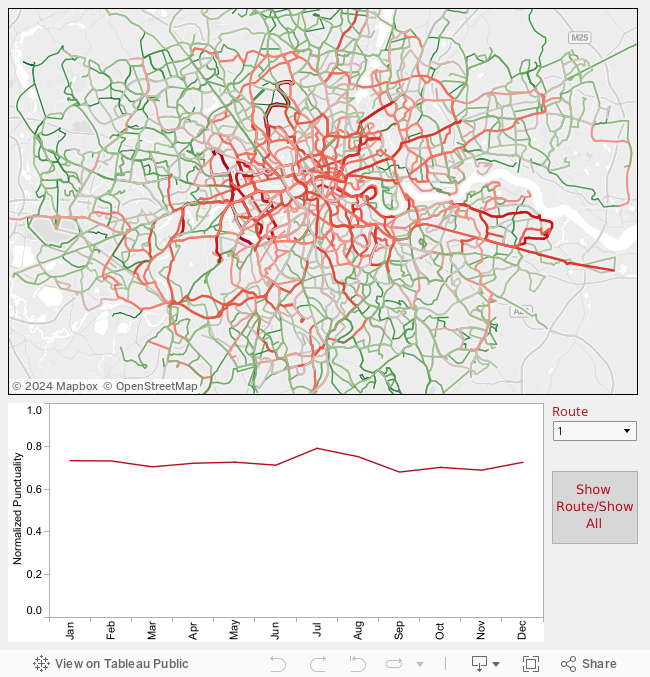
Bus punctuality is most visible in central London, where road construction and rush hour congestion can have a dramatic impact on bus performance. It really is no coincidence that the performance of bus routes increases fairly substantially the further one gets from the city centre. Below, a normalized index has been used to compare the punctuality of both high and low frequency bus routes.
“Street works will have a sharp impact on buses, particularly when they’re ready to be timetabled,” said London TravelWatch policy officer Robert Nichols. “Any road works on the route will have a cumulative effect over the course of the day. The recent changes that TfL has introduced in terms of the licensing of road works and restrictions on the time and length of roadworks, we think that will increasingly improve things and make roadworks less disruptive.”
This can be seen with Abellio London, which on the whole had the worst record for both high frequency and low frequency routes — it averaged 1.13 minutes of excess waiting time and an average 80.1% chance of its buses departing on time (respectively). The following chart lists punctuality by provider:
“The problems we have are your normal disruptions in London — when I say that, I mean road closures, diversions because of road works, demonstrations and other events held in the centre of London,” said an employee with Abellio involved with network performance. “We have many routes that go through the centre of London and the City. Unfortunately, these are also the areas where lots of events and disruptions are held and these can impact performance.”
Of Abellio’s routes, the 414 was the worst high frequency with an average of 1.49 minutes of excess waiting time, followed closely by the 172 with 1.48 minutes. The N35 was the worst low-frequency, with only 68.56% chance of departing on time.
“With [the 414 and the 172], it’s quite simply where they traverse,” said the Abellio employee. “Unfortunately, those routes go through some very popular areas, and what’s going on in those areas can have a dire impact on the service. The 414 goes through Fulham Road and Hammersmith, and for the last six months there’s always been roadworks on Fulham Road — that doesn’t help service.”
“You also have when Chelsea play at home and the impact it has when thousands of people come to view that — your buses just aren’t going to be on time,” he added.
Meanwhile, the 220 (run by London United) was the worst high frequency line in averaging nearly 2 minutes of EWT. The N109 (run by Arriva London) was the worst low frequency route, with an average 68.6% chance of departing on time. Abellio’s 172 had the worst month out of all the high frequency routes, with 2.97 minutes of EWT in March, while Metrobus’ R10 route only had a 29.8% chance of departing on time between 17 September and 14 October.
Looking more broadly, the period from 17 September to 14 October was worst for the high frequency bus routes, with 1.09 minutes of EWT. 12 November to 9 December was worst for the low frequencies, with all those routes averaging only a 82.9% chance of departing on time.
Credit to dot linking for Tableau TfL route shapes.
-
Note that this assumes the same amount of excess time spent waiting for the roughly half as many low frequency routes, which average an 85% chance of departing on time. Low frequency routes don’t use EWT, so it’s difficult to apply the “1 minute per trip” average to them, plus there is no breakdown of the 2.3 billion bus journeys number between low and high frequency routes. However, the collective 36 million hours stat above is still a very conservative estimate, as a “bus journey” as defined by TfL may involve multiple transfers, and there’s a possibility of EWT each time the user has to transfer to a different bus.
↩
